 In Part 1 of Kanban Software Development with GreenHopper we took a look at building the perfect visualisation and we explored approaches to highlighting important tasks. In this post we will investigate methods to help a team focus as well as approaches to building trust with customers by providing predictability. Our goal, of course, is to help the team reach their full potential.
It is important to note that Kanban is a pull system, not push. Teams pull work onto their board, and across their board. Teams pull work from left to right as capacity allows. This pull based approach ensures a team doesn’t have any work sitting idle, waiting, as that represents waste. It also helps the team avoid bottlenecks which otherwise may occur with or more steps in their workflow.
Focus to minimise context switching
Kanban teams focus. Focus, focus, focus. The cost of context switching1 can seriously impact a teams throughput. Kanban teams recognise that optimising their local throughput may actually decrease the throughput of the entire system. As a result Kanban teams swarm (aka dog pile) to get one item to done before picking up another. They focus.
How do we encourage swarming?
The Delta Squadron team has a column constraint set to visually notify them when they have exceeded their capacity in a given workflow step. This column constraint represents a WIP limit of the team size (7) that spans the In Progress and In Review columns.
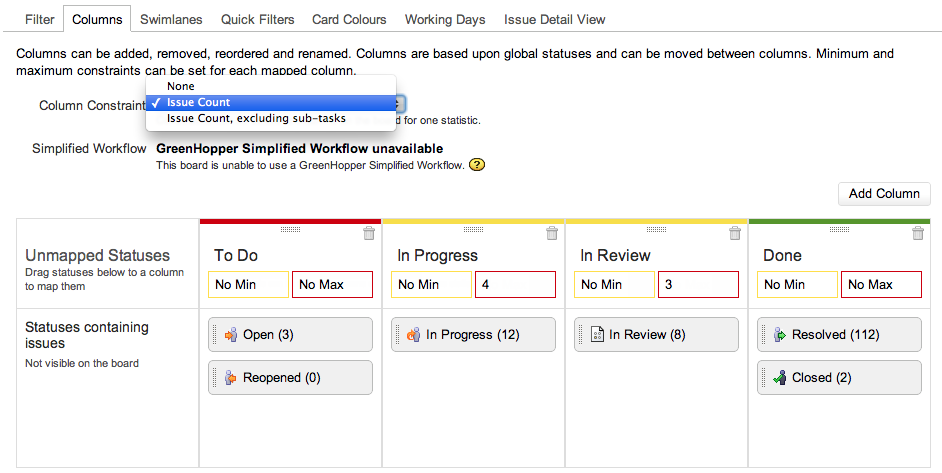
You can see above that we have selected the Issue Count as a Column Constraint and that we have limits of 4 and 3 in the In Progress and In Review columns respectively. When either of those limits are exceeded the column will turn red to notify the team.

GreenHopper is flexible. You can configure column constraints by ‘team size plus one’, a common approach for new Kanban teams, or ‘half the team size’, common when the team pairs2. These maximum column constraints give an easy, visual indicator when a Work In Progress (WIP) limit is busted.
The red column helps a team focus to pull work across the board and remedy bottlenecks quickly when they occur. It is painful to see. And it is meant to be, this is a bad state for the team to be in. A team with discipline will rarely see their column turn red.
How does a product owner know when to replenish the backlog?
As we mentioned earlier, Kanban is a pull based system. The product owner doesn’t want to push work onto the team.
As a product owner I use a minimum column constraint on the ‘To Do’ column. This prompts me to get more stories ready for development and pull them onto the board to replenish the queue as necessary. In the example below we can see both my need to replenish the queue (yellow) and that the team has too much work in progress (red).

Build trust with customers through predictability
Unlike their Scrum counterparts the Delta Squadron team doesn’t measure velocity in terms of story points per sprint – there are no sprints against which to measure. Instead, the team focuses on throughput as measured using cycle time.
Cycle Time is the amount of time that a task spends between the To Do (LHS) and Done (RHS) columns. This is the time the task spent as Work In Progress. GreenHopper captures as all of the columns in the middle of the board.
Cycle Time’s cousin is Lead Time. Lead Time captures the time from when a task is created to when it reaches the Done (RHS) column. This is the total amount of time a customer waited for their request to be fulfilled.
How do we measure cycle time?
GreenHopper includes a control chart, this is a scatter plot of all issues that have been completed. The control chart can be used to identify both the cycle time and the lead time.
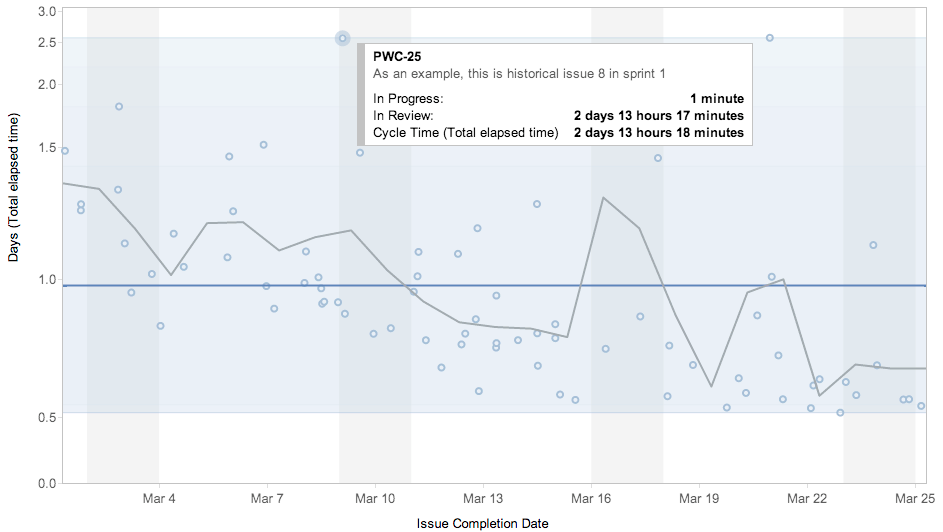
We can see in the chart above that the team is looking at an outlier, an issue that took longer to complete than anticipated. Delta Squadron may ask themselves in their retrospective why an issue that only took a minute to fix sat in the In Review column for over two days.
The solid grey vertical bars represent the weekends, the teams non-working days. Non-working days can be set on the board configuration. The solid blue line is the average for the whole time period being investigated. The grey line is the trending average over the time period being investigated.
Ideally a team will have a consistent cycle time. Wide fluctuations in the cycle time make discerning predictability difficult.
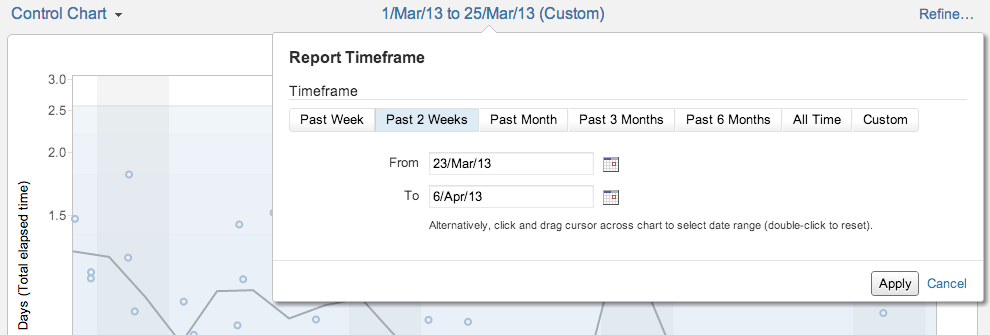
Teams can explore cycle time in a number of ways. There is the ability to pick a time period and also the option to refine the chart by swimlane, column or quick filter.
How do we get predictable?
Kanban teams don’t always estimate. However, it can be useful for providing predictability to the team, the product owner, and the customer.
Often Kanban teams will estimate using S/M/L t-shirt sizing. This is a simple exercise that often doesn’t include a whole team, unlike a sprint planning and estimation session for a Scrum team. For instance, in Delta Squadron the product owner and a technical lead sit together to bucket the stories into Small and Medium, anything that the technical lead deems a Large is broken down into smaller pieces.
The team does this so that they have a rough estimate (well, all estimates are guesses anyway) of how much effort is involved. They want to get rid of the Large ones – by splitting them up – so they can reduce the risk associated with delivery. Finally, this helps get tasks across the board as they are all a similar size.
Finally, we can take the cycle time from above and look at the cycle time for a Small. It may be two days. The product owner can use this to give the customer an indication of when the task may be complete.
How do we run a daily standup?
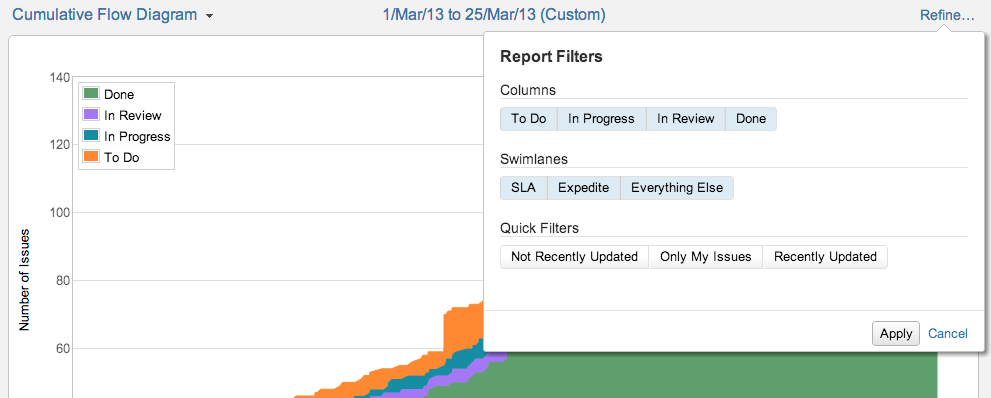
While we spend most of the daily stand up on the Work mode of our Kanban board in GreenHopper it is sometimes useful to jump over to the cumulative flow diagram. The cumulative flow diagram shows the amount of work in each of the states each day.

Like the Control Chart it is possible to Refine the Cumulative Flow Diagram to show only the information you are interested in. Use this to pinpoint bottlenecks or look at one class of service.
How do we share the teams progress?
Of course, you can also take all of these great charts and place them on your information radiator3. The information radiator is available via a JIRA Add-on call JIRA Wallboards. It is intended to be displayed on a large TV mounted on the wall of the office.
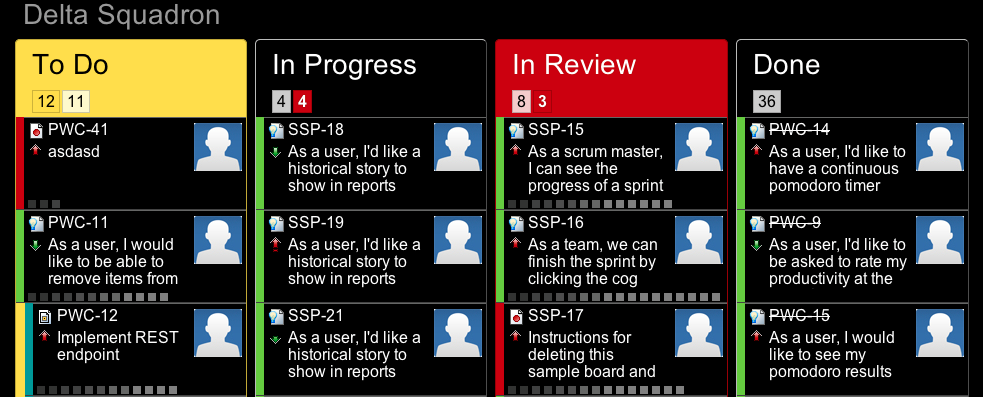
Remember that we had the column constraints enabled, this is how you quickly communicate to the team that they have exceeded their WIP limits.
Wallboards are a great way to share what a team is working on at present for both the team and their peers. You can take it further though and add items like build status, Twitter searches, sales and support statistics or anything you can come up with to get people looking at the Wallboard.
Conclusion
We’ve covered a lot of ground in Part 1 and, now, Part 2. I hope you’re feeling more comfortable Kanban and are ready to make use of all the great GreenHopper functionality and flexibility – make it just right for your team and make your agile transformation successful.
Have fun,
Muldoon
Find this useful? React on Twitter:
Kanban Software Development with GreenHopper http://t.co/YQR0oUy8Kt
— Nicholas Muldoon (@njm) April 8, 2013


