Archives For Agile

Live from Agile 2013

Great session this morning on technical debt, led by Israel Gat. If you haven’t seen him run through this deck I recommend you look for a video. Excerpts below.

Technical Debt Ratio

Technical debt is a monetary value for non-quality in software. When teams look at this they want to figure out what their debt ratio is, similar to when you purchase a house and look at the debt ratio (equity in your house vs the mortgage).

Israel showed off a neat dashboard gadget that listed a products debt ratio, mortgage value in $, work days to paydown the debt and a breakdown by complexity. I need to chase up with him to see what product provided that gadget.

The time a team spends working on technical debt is a missed opportunity to work on features and deliver value to their customer. And, of course, you pay interest on that debt so long as you have it. Technical debt turns code into a liability, not an asset (TD+C<V).

Israel talks of three types portions of the mortgage – the principal, the recurring interest, and the compound interest. Think of the first two as the regular stuff you have with a mortgage. The third one, compound interest, comes into effect primarily when you copy and paste code leading to a multiplicative expansion in the code that needs to be maintained.

Teams can measure technical debt using:

  • Principal – test coverage, code duplication, cyclomatic complexity
  • Recurring Interest – support cases, product maintenance
  • Compounding Interest – growth in Principal over time

Pay Down Technical Debt

Before you start tackling technical debt you should make sure added / updated code is under control. Address the root cause – train the team so they don’t write code with high technical debt in future.

Technical debt is a vicious cycle, the longer we leave it the more we accrue, the slower the process is. Decreasing team velocity and happiness. One approach is to manage software delivery through WIP limits.

Don’t start by paying off legacy debt. Instead, start by training teams to write better code, allowing then to write better new code and also refactor existing code more effectively.

May get more value from focusing on paying down compounding interest first, due to its exponential effect. Then move on to recurring interest. However, you may want to reverse the approach this if the company’s cash flow doesn’t provide a buffer enabling the team to await for a reduction in duplicate code.

Outcomes

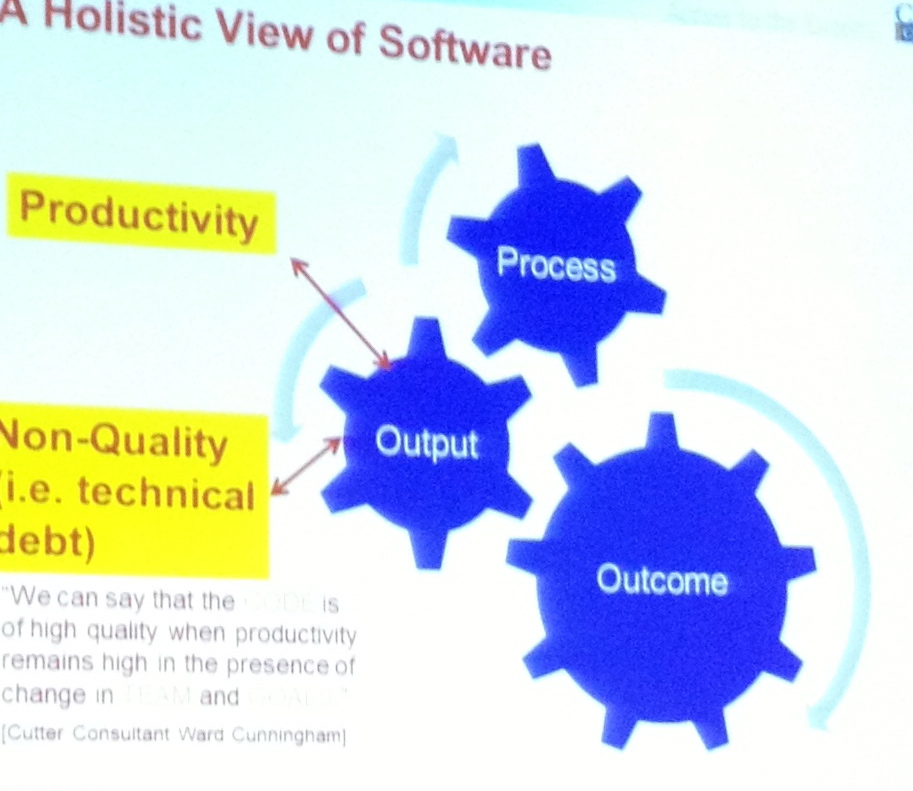
Process is just a thing teams and organisations use to deliver code (output). The real value though is the outcome, the value delivered to the customer. If you build up technical debt, you deliver less value to the customer.

Great visual:

process delivers output which delivers outcome

Takeaway

Is it a methodology, a business, or and operational issue?

Remember, technical debt is not the problem, it is a symptom. Find the root cause, which is most often the teams experience and approach to developing software. Sometimes the root cause may be the company trying to do too much work at once, or not allowing the teams to find and maintain a sustainable pace.

Like this? Follow Israel Gat and react on Twitter:

Agile Coaching

August 7, 2013

Live from Agile 2013

I participated in a session by Lyssa Adkins and Michael Spayd of the Agile Coaching Institute yesterday. It was a good reminder, and provided some insightful new thoughts.

Lyssa and Michael put together the Agile Coaching Competency Framework and they are also working on the Agile Coaching Learning Objectives.

Agile Coaching Competency Framework

This is great! I know where I stand on each of these, and I know what to be looking for when hiring Agile Coaches in the future to ensure that we’ve got a balanced team.

Agile Coaching Competency Framework


We can’t expect everyone to be strong in every area, so how can we complement the skills of the existing team? Well, Lyssa and Michael suggest you explore your current coaching team and also what you need when you next hire. Gold.

Agile Coaching Learning Objectives

The ACLO covers the key roles: Agile Team Facilitator, Agile Coach, and Enterprise Agile Coach. When the Scrum Alliance is certifying Certified Scrum Coaches they are looking for Enterprise Agile Coaches – good to know. Find the most recent draft here.

My key takeaway from this session though was to take a facilitator class, Lyssa and Michael emphasised that this was such an important piece.

One final thought, for more on this take a look at Craig Smith’s Agile Coaching Workshop presentation.

Enjoy this? React on Twitter:

Live from Agile 2013

Great session this morning from @DocOnDev, the Director of Engineering at Groupon.

Velocity is units/time with direction. Many teams struggle to obtain a stable velocity. Velocity is a lagging indicator like unemployment, or the weather forecast. You don’t fix unemployment by focusing on that, you fix unemployment by fixing the economy. Doc’s talk explored an approach to helping teams improve, without encouraging them to increase their velocity.

At the end of the iteration you have velocity. A simple measure of a complex system. Adjusting velocity doesn’t mean we are a healthier team or company. We could still achieve velocity with a bad outcome (technical debt). While velocity can be a good long term predictor, it can be negative in the short term if teams focus is simply on increasing velocity for velocity’s sake. Also, do not compare one teams velocity to another.

Two examples: 10,11,9,10 and 7,14,6,10 (same team over time). In both cases the “tomorrow’s weather” approach gives you an estimate of 10. Same result with a rolling average. Both are misleading. Once you add standard deviation, and a confidence interval, to the “yesterday’s weather” and rolling average you get more accuracy.

Perhaps though, consistency is key. Managers should not ask teams to hit a target velocity.

Three Laws that influenced Doc:

  • Hawthorn Effect – that which is measured will improve, at a cost…
  • Goodharts Law – when a measure becomes a target it ceases to be a good measure.
  • Friedmans thermostat. – correlation is not causation.

In order to deliver more points to meet the target the team will sacrifice quality, slowing the team down in the long term with technical debt. Deming recommended businesses focus on the system and how people are working together.

Agile Metrics

Get a different perspective on the team by exploring the following reports. You can still look at the Velocity Chart, just remember that there are other – sometimes better – metrics to look at for specific team issues.

Scatter diagrams

Plot velocity by cyclomatic complexity. The more complex the code gets the less the team can deliver in a given iteration. If we optimise for the long term (minimise technical debt) the team will be faster – this is the business case for paying off technical debt.

Positive correlation – as we have more code coverage, velocity goes up. At the unit level you have to write code that is easily testable, and the by product is low coupled code with low cyclomatic complexity. Doesn’t have the problems inherent when writing tests after writing the code.

Control Chart

Look at the lead time and cycle time for a team. Where does the team spend their time?

Cumulative Flow Diagram

Quickly identify the growth of the backlog over time, whether the team could get more impact by focusing on improving quality, minimising WIP, working with the product owner to write better stories, etc.

Team Happiness

Team joy may be a leading indicator in team performance. Doc’s experience at Groupon may have been clouded by the sampling rate (more frequent than sprint velocity). How do they measure this? By allowing engineers to submit a health metric as part of their commit message.

Knowing how the team feels about things allows us to identify what’s going on. One option for this is MoodApp.

Takeaways – Agile Metrics

Remember, metrics are not for managers, they are for teams to learn and explore how they can improve themselves. Don’t simply use the Velocity Chart, take advantage of what is available and explore all options.

Look at the Control Chart in JIRA to see your teams lead and cycle time. Look at the Cumulative Flow Diagram in JIRA to see the WIP and where your team is spending most of their time. And remember:

  • that which is measured will improve, at a cost.
  • when a measure becomes a target it ceases to be a good measure.
  • correlation is not causation.

One final thought Doc shared: if you measure the time spent on a project you have an opportunity for capitalisation.

Find Agile Metrics slides on Slideshare.

Like this stuff? Follow @DocOnDev and react on Twitter: